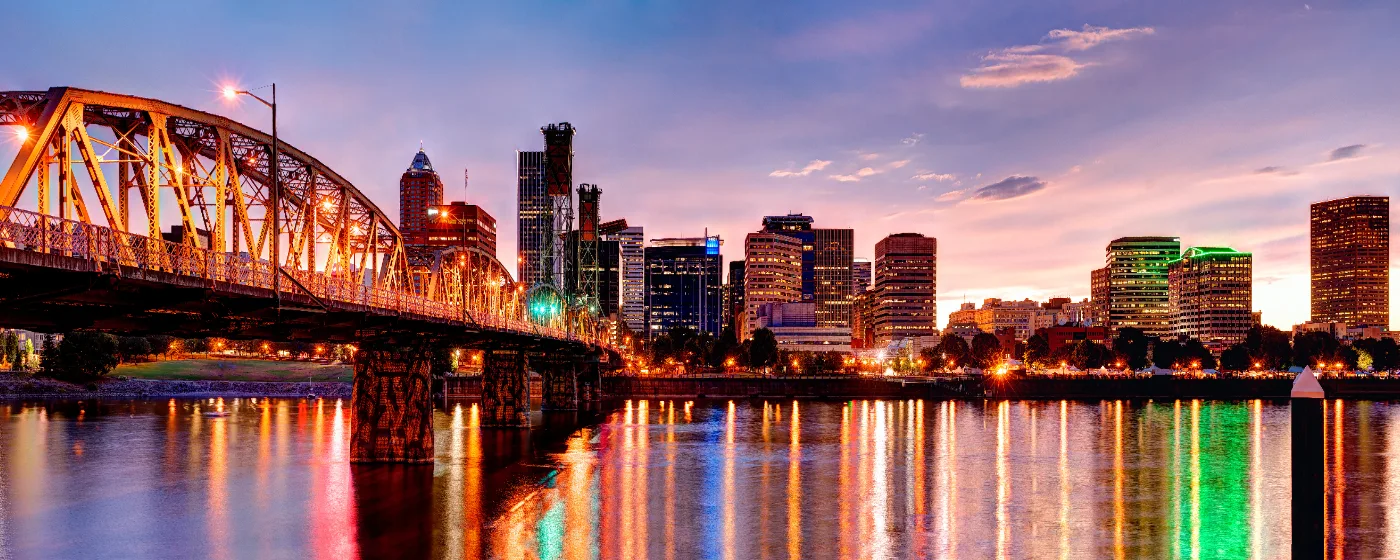
Portland Metro · Oregon
Is Portland Safe? Crime Rates, Safest Neighborhoods & Local Reality (2026)
Portland's safety reputation tends to arrive before Portland itself does. If you're relocating here, you've probably already seen the national headlines, the Reddit threads, and the alarmed reactions from friends who've never been west of Denver. The reality is more layered: Portland has genuine public safety challenges — particularly around property crime and uneven police response times — but it's also a city of 630,000 people where most residents go about daily life without incident, and where 2025 brought the most dramatic violent crime decline of any major U.S. city tracked by federal researchers.
The numbers matter here, and they require context. A citywide crime rate tells you almost nothing about what it's like to live in Sellwood or Alameda. Portland is a geographically sprawling city with neighborhoods that feel genuinely different from each other in character, density, and day-to-day safety experience. The westside hills, the inner eastside, and the far outer neighborhoods operate as distinct environments — and treating them as one monolithic safety story is how buyers make bad decisions in either direction.
This guide cuts through both the panic and the spin. You'll come away with a grounded understanding of Portland's actual crime trends, which neighborhoods carry the most and least risk, how the city compares to its neighbors, and the practical day-to-day reality that locals have quietly adapted to — and that relocating buyers rarely hear about until they're already moved in.
Portland's crime figures look alarming in isolation, and that's a fair reaction when you see them. FBI data for 2024 puts the citywide violent crime rate at roughly 5.3 incidents per 1,000 residents, and property crime at approximately 45 per 1,000 — both well above Oregon's statewide averages and roughly double the national rate for property crime. The city's overall crime grade from aggregated data platforms sits near the bottom of the national curve, which explains why Portland consistently surfaces in "most dangerous cities" rankings that don't account for geographic concentration or year-over-year trajectory.
What those rankings consistently miss is directional momentum. The first half of 2025 brought the steepest violent crime drop of any of the 68 major agencies tracked by the Major Cities Chiefs Association — a 17 percent reduction compared to the same period in 2024. Homicides fell 51 percent in that stretch, from 35 incidents to 17, and the city finished 2025 with 51 total homicides compared to 68 the year before. That's still a significant number for a city Portland's size, but it represents real, measurable progress after years of post-pandemic deterioration. Property crime similarly fell roughly 12 percent, with motor vehicle theft dropping to its lowest level since 2016.
The structural drivers behind Portland's elevated numbers are worth understanding. The city has roughly 1.1 to 1.3 sworn officers per 1,000 residents — less than half the national average for cities of comparable size — which limits both proactive enforcement and response time. High-priority calls that historically received six-to-eight-minute responses have in recent years stretched past 20 minutes. That gap between call volume and available officers shapes what crime looks like in practice: more opportunity-based property crime, slower accountability, and a perception of disorder that compounds actual disorder. New Mayor Keith Wilson, who took office in early 2025, has pointed to the declining homicide rate and increased drug enforcement as early indicators that the city's trajectory is changing.
Local police data suggests Portland's violent crime rate of roughly 5.3 per 1,000 residents in 2024 — while above the national average — remains well below the city's own historical peak of approximately 7.0 per 1,000 in the mid-1990s. In practical terms, most Portland residents experience violent crime as something that happens in specific corridors during specific hours rather than a diffuse citywide risk. The neighborhoods and commercial strips with the highest concentrations of unhoused encampments, open drug markets, and late-night activity account for a disproportionate share of reported incidents — a geographic reality that matters enormously for anyone choosing where to live.
Property crime is Portland's most persistent daily challenge, and motor vehicle theft is the specific category that most directly affects residents. Portland's car theft rate remains among the highest of any major U.S. city, with roughly a 1-in-115 chance of vehicle theft citywide — though that risk clusters heavily around certain commercial corridors and transit-adjacent parking areas. Package theft, bike theft, and vehicle break-ins are the most frequently reported complaints across neighborhoods. The encouraging note is that this is also the category showing the most consistent improvement: motor vehicle theft was down roughly 1,163 incidents year-over-year through mid-2025, and property crime overall is trending in the right direction for the first time in several years.

Portland's safety picture is genuinely improving, and I think buyers who researched this city two or three years ago may be operating on outdated assumptions. The neighborhoods that have always been desirable — Sellwood, Alameda, Laurelhurst, the Pearl — held their value and their livability through Portland's roughest stretch, and they're now seeing renewed buyer confidence as the broader city data turns positive. What I tell clients who are nervous about Portland is this: buy in an established neighborhood with strong owner-occupancy rates and you're living a fundamentally different daily experience than the headlines suggest.
The mistake I see relocating buyers make most often is conflating the commercial corridors — particularly stretches of 82nd Avenue, parts of downtown near Old Town, and some sections of outer Division — with the residential neighborhoods adjacent to them. A home three blocks off a challenging commercial strip can be quiet, walkable, and genuinely community-oriented. The buyers who do their homework, walk the actual streets at different times of day, and talk to neighbors before making an offer consistently feel good about their decision. The ones who rely entirely on citywide crime maps often either pass on great opportunities or, worse, buy in the wrong spot because the map didn't capture the micro-level reality. If you're considering Portland and want insight into which neighborhoods align with your priorities and budget, I'd welcome the opportunity to share what I've learned from helping hundreds of families make this move successfully.
The Pearl sits in Northwest Portland between the river and the West Hills, and it's among the most actively managed residential environments in the city. The neighborhood's density, high owner-occupancy in its condo buildings, and consistent street activity from restaurants and galleries give it a baseline level of natural surveillance that quieter neighborhoods lack. Property crime — particularly vehicle break-ins in ground-level parking structures — remains the primary concern, and residents here commonly use secured parking garages rather than street parking as a direct response. The Pearl also borders Old Town/Chinatown to the south, and the transition between the two neighborhoods is abrupt and meaningful for understanding daily street conditions.
Best for: Buyers who want urban density, walkability, and a professionally managed building environment — and who are willing to budget for secured parking.
Hawthorne in Southeast Portland occupies an interesting middle ground: a lively commercial corridor through the heart of a stable residential neighborhood. The boulevard itself sees a mix of foot traffic including a visible unhoused population near certain stretches, but the residential blocks running north and south into Buckman, Mount Tabor, and Richmond feel grounded and community-oriented. Residents here commonly report that awareness of which blocks transition from commercial to residential makes a practical difference in daily experience. Package theft and bike theft are the most frequent complaints, consistent with a dense neighborhood where porches face the street and bike racks see heavy use.
Best for: Buyers who want walkable neighborhood character with a mix of coffee shops, independent retail, and quick access to Mount Tabor Park.
Officially the Alphabet District and commonly called Nob Hill, this Northwest Portland neighborhood runs from West Burnside north through alphabetically named cross streets — Ankeny, Burnside, Couch — and into the residential blocks of the 20s. It's flanked by Forest Park to the west and the Pearl to the east, which gives it a comfortable buffer of residential density on all sides. Crime here tends to run with the commercial density along NW 21st and 23rd Avenues, where late-night foot traffic and proximity to downtown creates the same vehicle break-in patterns seen in other active commercial corridors. The residential interior blocks, however, are notably quieter and benefit from strong neighborhood association engagement.
Best for: Buyers drawn to walkable, historic streetscapes with close access to both Forest Park trails and Pearl District amenities.
Alberta Arts is one of Northeast Portland's most recognizable neighborhood corridors, and its safety profile reflects the character of a neighborhood mid-transition. The stretch of Alberta Street between roughly MLK Boulevard and 33rd Avenue is active and commercially diverse, but the residential blocks immediately adjacent vary noticeably in character block by block. Northeast Portland broadly has seen some of the most meaningful crime reductions in the 2025 data, and Alberta's trajectory has followed suit. Car prowl and occasional theft from commercial areas remain the most common reported issues; the neighborhood's active arts community and frequent evening events along the corridor contribute to consistent foot traffic that tends to deter opportunistic crime.
Best for: Buyers who value neighborhood identity, walkable arts and food culture, and are comfortable with the block-by-block variation that defines inner Northeast Portland.
Sellwood in Southeast Portland sits at the southern end of the city near the Willamette River, and it consistently ranks among Portland's calmer residential neighborhoods in available crime data. The combination of distance from downtown commercial corridors, strong single-family home ownership rates, and a neighborhood character that skews toward established households makes Sellwood one of the more consistently low-incident areas in the city. The Sellwood Bridge area sees some activity related to river access and the Springwater Corridor trail, where occasional property crime around unattended vehicles in trail parking areas is the most frequently noted concern.
Best for: Buyers looking for a quieter, residential pocket of Portland with a small-town feel and strong neighborhood cohesion.
Alameda in Northeast Portland occupies the ridge above Grant Park and represents one of the city's more consistently stable residential environments. The neighborhood's elevated topography, single-family character, and strong owner-occupancy rates contribute to a safety profile that sits noticeably below citywide averages in most available data. It's the kind of neighborhood where residents know their neighbors by name, block parties are genuinely common, and the primary crime-related concern is package theft from front porches — a citywide issue that Alameda shares with virtually every other residential Portland neighborhood. Its proximity to Grant High School and Grant Park keeps the street life family-oriented throughout the day.
Best for: Buyers prioritizing residential stability, strong schools proximity, and one of Portland's most architecturally intact historic streetscapes.
| City | Violent Crime/1K | Property Crime/1K | Overall Safety Profile |
|---|---|---|---|
| Portland | ~5.3 | ~45 | Below average nationally; improving trend |
| Beaverton | ~2.1 | ~24 | Well below Portland; stable suburban profile |
| Gresham | ~4.8 | ~38 | Comparable to Portland; similar challenges |
| Lake Oswego | ~0.9 | ~12 | Among the safest in the metro area |
| Milwaukie | ~2.4 | ~22 | Meaningfully safer than Portland proper |
| Vancouver, WA | ~3.2 | ~31 | Safer than Portland; cross-river alternative |
| Hillsboro | ~2.0 | ~23 | Low crime; strong suburban safety profile |

When buyers ask me about Portland, the conversation almost always turns to neighborhood selection pretty quickly — and for good reason. Areas like the Pearl District, Hawthorne, and Sellwood consistently hold their value well, partly because of walkability and community investment, but also because buyers genuinely want to be there. That demand is real. Desirable homes in these neighborhoods, particularly those priced under $750,000, can move within days of hitting the market. Alameda and the Alberta Arts District tell a similar story. Perceived safety and neighborhood stability absolutely factor into long-term appreciation, so where you buy in Portland matters as much as what you buy.
What I'd encourage any buyer to do before touring a single home is sit down with a lender first. Your pre-approval number is not your budget. The full monthly payment — once you fold in property taxes, homeowner's insurance, any HOA dues, and your loan structure — can look meaningfully different from what the purchase price suggests. Understanding what feels comfortable, not just what's technically approved, means you can move decisively when the right home in the right neighborhood appears. In a market like Portland, that readiness matters.
What the crime apps don't show you is the geographic granularity that actually matters. The citywide D- crime grade that surfaces on real estate search platforms reflects conditions along specific corridors — particularly Old Town/Chinatown, stretches of outer 82nd Avenue, the area around the 205 corridor in East Portland, and certain sections of North Portland near Columbia Boulevard — that are genuinely challenging and that most residential buyers are not actually considering. When a buyer narrows their search to Laurelhurst, Sellwood, or Nob Hill, they're operating in a fundamentally different risk environment than the citywide number implies, and treating the aggregate figure as their decision-making data is a mistake.
What longtime Portland residents do practically is relatively mundane: they don't leave anything visible in parked cars, they use secured parking when available downtown, they track packages actively and use Amazon locker or neighbor pickup arrangements when possible, and they pay attention to which stretches of commercial corridors change character after dark. None of that is dramatically different from what residents do in Seattle, Denver, or Chicago. The specific Portland version of urban awareness just gets more media attention, partly because Portland's homelessness crisis has been more visible in public spaces than in many comparable cities, and partly because the city's political identity makes its dysfunction a national story.
The other thing locals know is that Portland's alternative first-response infrastructure — Portland Street Response, which handles behavioral health and mental health crisis calls — has quietly changed how certain incidents are handled in residential neighborhoods. Calling 911 for a person in crisis near your home will frequently dispatch a social work team rather than a police response, which has reduced both escalation incidents and wait times for that category of call. It's an imperfect system that's still scaling, but it represents a genuine shift in how the city manages the intersection of homelessness, mental health, and public safety that's worth understanding before you conclude that Portland has simply given up.
Local Expert Takeaway: Focus your search on neighborhoods with strong owner-occupancy rates and active neighborhood associations — Alameda, Sellwood, Laurelhurst, and Nob Hill consistently show safety profiles well below Portland's citywide numbers. Avoid drawing conclusions from aggregate city crime maps; instead, pull the PPB's open data portal crime map and filter by specific incident type and block range for any address you're seriously considering. The block-level difference between a quiet residential street and a challenging commercial corridor in Portland can be as little as two or three houses.
✅ Portland's violent crime dropped 17% in the first half of 2025 — the steepest decline of any major U.S. city tracked federally — and homicides fell more than 50% in that period, signaling real momentum after years of post-pandemic increases.
⚠️ Property crime remains elevated citywide, with motor vehicle theft and package theft being the most frequent daily concerns; residents in all neighborhoods commonly adapt with secured parking and active package management.
📍 Neighborhood selection matters enormously — Alameda, Sellwood, and Laurelhurst operate in a safety environment that looks very different from Portland's aggregate numbers, while stretches of Old Town, outer 82nd, and parts of East Portland carry the city's highest risk concentrations.
Is Portland safe to live in?
Portland has real public safety challenges, particularly around property crime and police response times, but it's a city where safety experience varies dramatically by neighborhood. Established residential areas like Alameda, Sellwood, and Laurelhurst see crime rates well below the citywide average, and 2025 data shows the most significant violent crime reduction the city has recorded in years. Most residents in these neighborhoods describe daily life as comfortable and uneventful.
What is the crime rate in Portland?
Local police data and FBI estimates put Portland's violent crime rate at roughly 5.3 incidents per 1,000 residents and property crime at approximately 45 per 1,000 for 2024 — both above Oregon and national averages. The city is trending meaningfully downward heading into 2026, with property crime down roughly 12 percent and violent crime down 17 percent in the first half of 2025 compared to the same period the prior year.
How does Portland compare to nearby cities for safety?
Portland's crime rates are higher than most of its neighbors — Lake Oswego, Hillsboro, Beaverton, and Milwaukie all report substantially lower violent and property crime figures. Gresham tracks somewhat closer to Portland's numbers. For buyers where safety is the primary filter, the suburbs offer a meaningfully lower-risk profile; for buyers who want Portland proper, neighborhood selection within the city is the most important variable.
Browse current listings updated daily — filtered for Portland buyers by Elizabeth Davidson, your local expert.
Powered by Elizabeth Davidson · Cascade Hasson Sotheby's International Realty · 503-939-2035
Explore the full Portland series: The Ultimate Portland Relocation Guide · Is Portland Safe? · Cost of Living in Portland · Best Neighborhoods in Portland · Portland Schools & Family Life · Portland Youth Sports · Portland Parks & Recreation · Retiring in Portland · 1031 Tax-Deferred Exchange in Portland · Portland First-Time Homebuyers Guide · Portland Down Payment Assistance Guide · Moving to Portland from California · The Portland Realtor's Perspective · Top 10 Questions a Realtor Gets About Portland